Question and mechanism
Flooding may change property values through damage, unreliable access, repair cost, or updated beliefs about future drainage risk. A satellite records a surface response at a specific time. It does not directly record damage, access, buyer information, or transactions. The paper asks what evidence is required before that surface becomes a treatment in an urban-capitalization design.
Economic admission audit
The audit separates reproducible image processing, physical-target validity, economic salience, historical geography, assignment-unit support, and the eventual outcome design. These decisions were frozen before housing outcomes could choose a satellite threshold.
The conservative optical rule reaches 10 of 541 polygons in the reviewed CSB-to-MOJ bridge, while the same pre-mask rule reaches 15 of 232 held-out polygons, including Sabah Al-Ahmad. Radar candidates reach 49, 26, and 11 approved polygons, but none passes the frozen radar-optical agreement rule. Exact-time late-November point truth is unavailable in the audited public sources.
The unit glossary is deliberate: CSB polygons are source geography; MOJ-linked blocks are the bridge; assignment units are treatment-link units; and exploratory analysis blocks are the estimable observation units. Official KUNA reporting records public mobilization, closures, shelters, drainage, and reopening during the November sequence, but those reports do not identify exact-time surface water, realized block-level compensation, or market treatment: mobilization, closures and diversions, shelters, and drainage and reopening.
What the paper finds
View full-size figure (opens in a new tab)
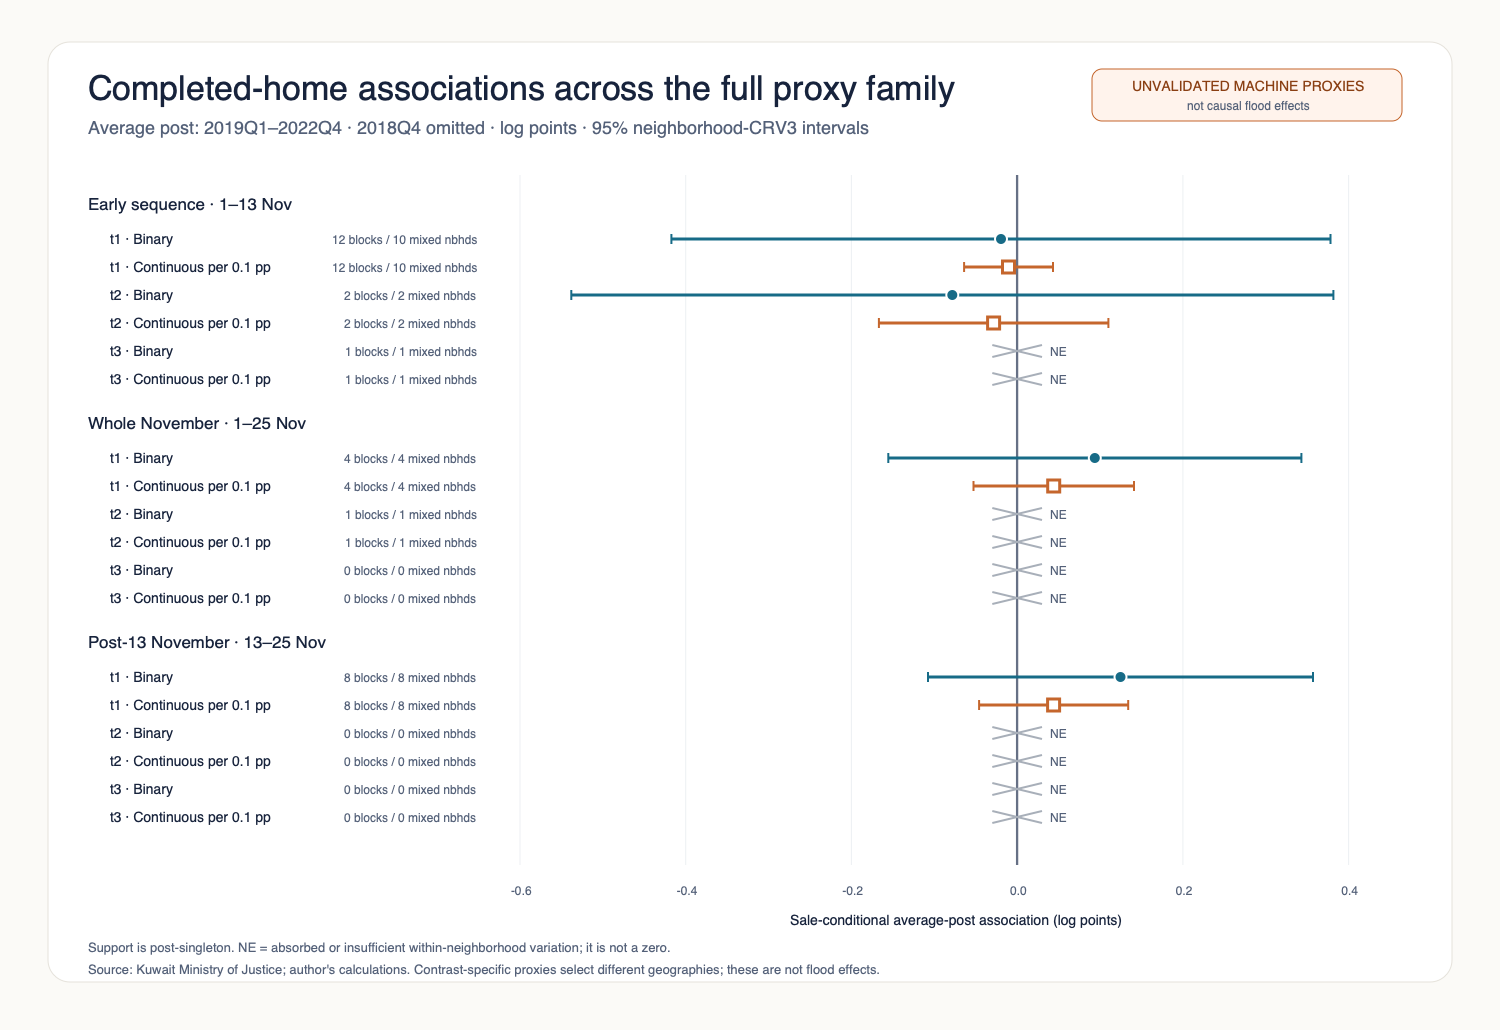
After singleton removal, the highest-support early-sequence completed-home fit uses 12 candidate blocks in 10 neighborhoods. Its association is -0.020 log points with a 95 percent interval of [-0.417, 0.378]. A whole-November definition gives +0.094 and a post-13-November definition gives +0.125. The latter two proxy-positive block sets do not overlap, so the pattern is joint timing-and-geography sensitivity, not a clean comparison of clocks. Pretrend equivalence is not established and support is leverage sensitive. The analysis establishes neither a zero nor a nonzero flood effect; the proxy associations are compatible with both directions.
What the paper does and does not claim
The paper shows that reproducible pixels do not automatically identify an economic effect. Geography linkage and market salience are part of treatment measurement. It does not claim that only ten places flooded, that the storms had no price effect, or that the exploratory coefficients measure verified flood damage.
A causal extension needs event-time positive and dry validation, damage or access evidence, repaired historical geography, dispersed block support, and a design for sale selection and spatial inference.
Citation and data source
Suggested citation: Abdulmalik Altararwa. 2026. "When Does a Flood Map Become a Treatment? An Outcome-Blind Economic Admission Audit in Kuwait." Working paper.
Transaction source: Kuwait Ministry of Justice, Live Registered Real-Estate Sale-Price Query. Exploratory price estimates are the author's calculations from registered transactions. The public PDF contains aggregate estimates and no transaction rows, deed identifiers, or exact transaction locations.